With actionable real-time data, we enable forward-thinking businesses to plan, grow, and move sustainably into the future.
Request demo


Global Coverage
The global bunker market plays a vital role in the maritime industry by supplying fuel to ships engaged in international trade and transportation. As global shipping operations expand, the demand for bunker fuel continues to rise, driven by increasing trade volumes and evolving industry regulations.
14K+
Track of monthly bunkered vessels
9M+
Monthly bunker volume tracked by Spotbarge
22
Major regions covered
Spotbarge monitors the world's major bunker hubs, including ARA, Singapore, the Mediterranean, Fujairah, Panama, and more.
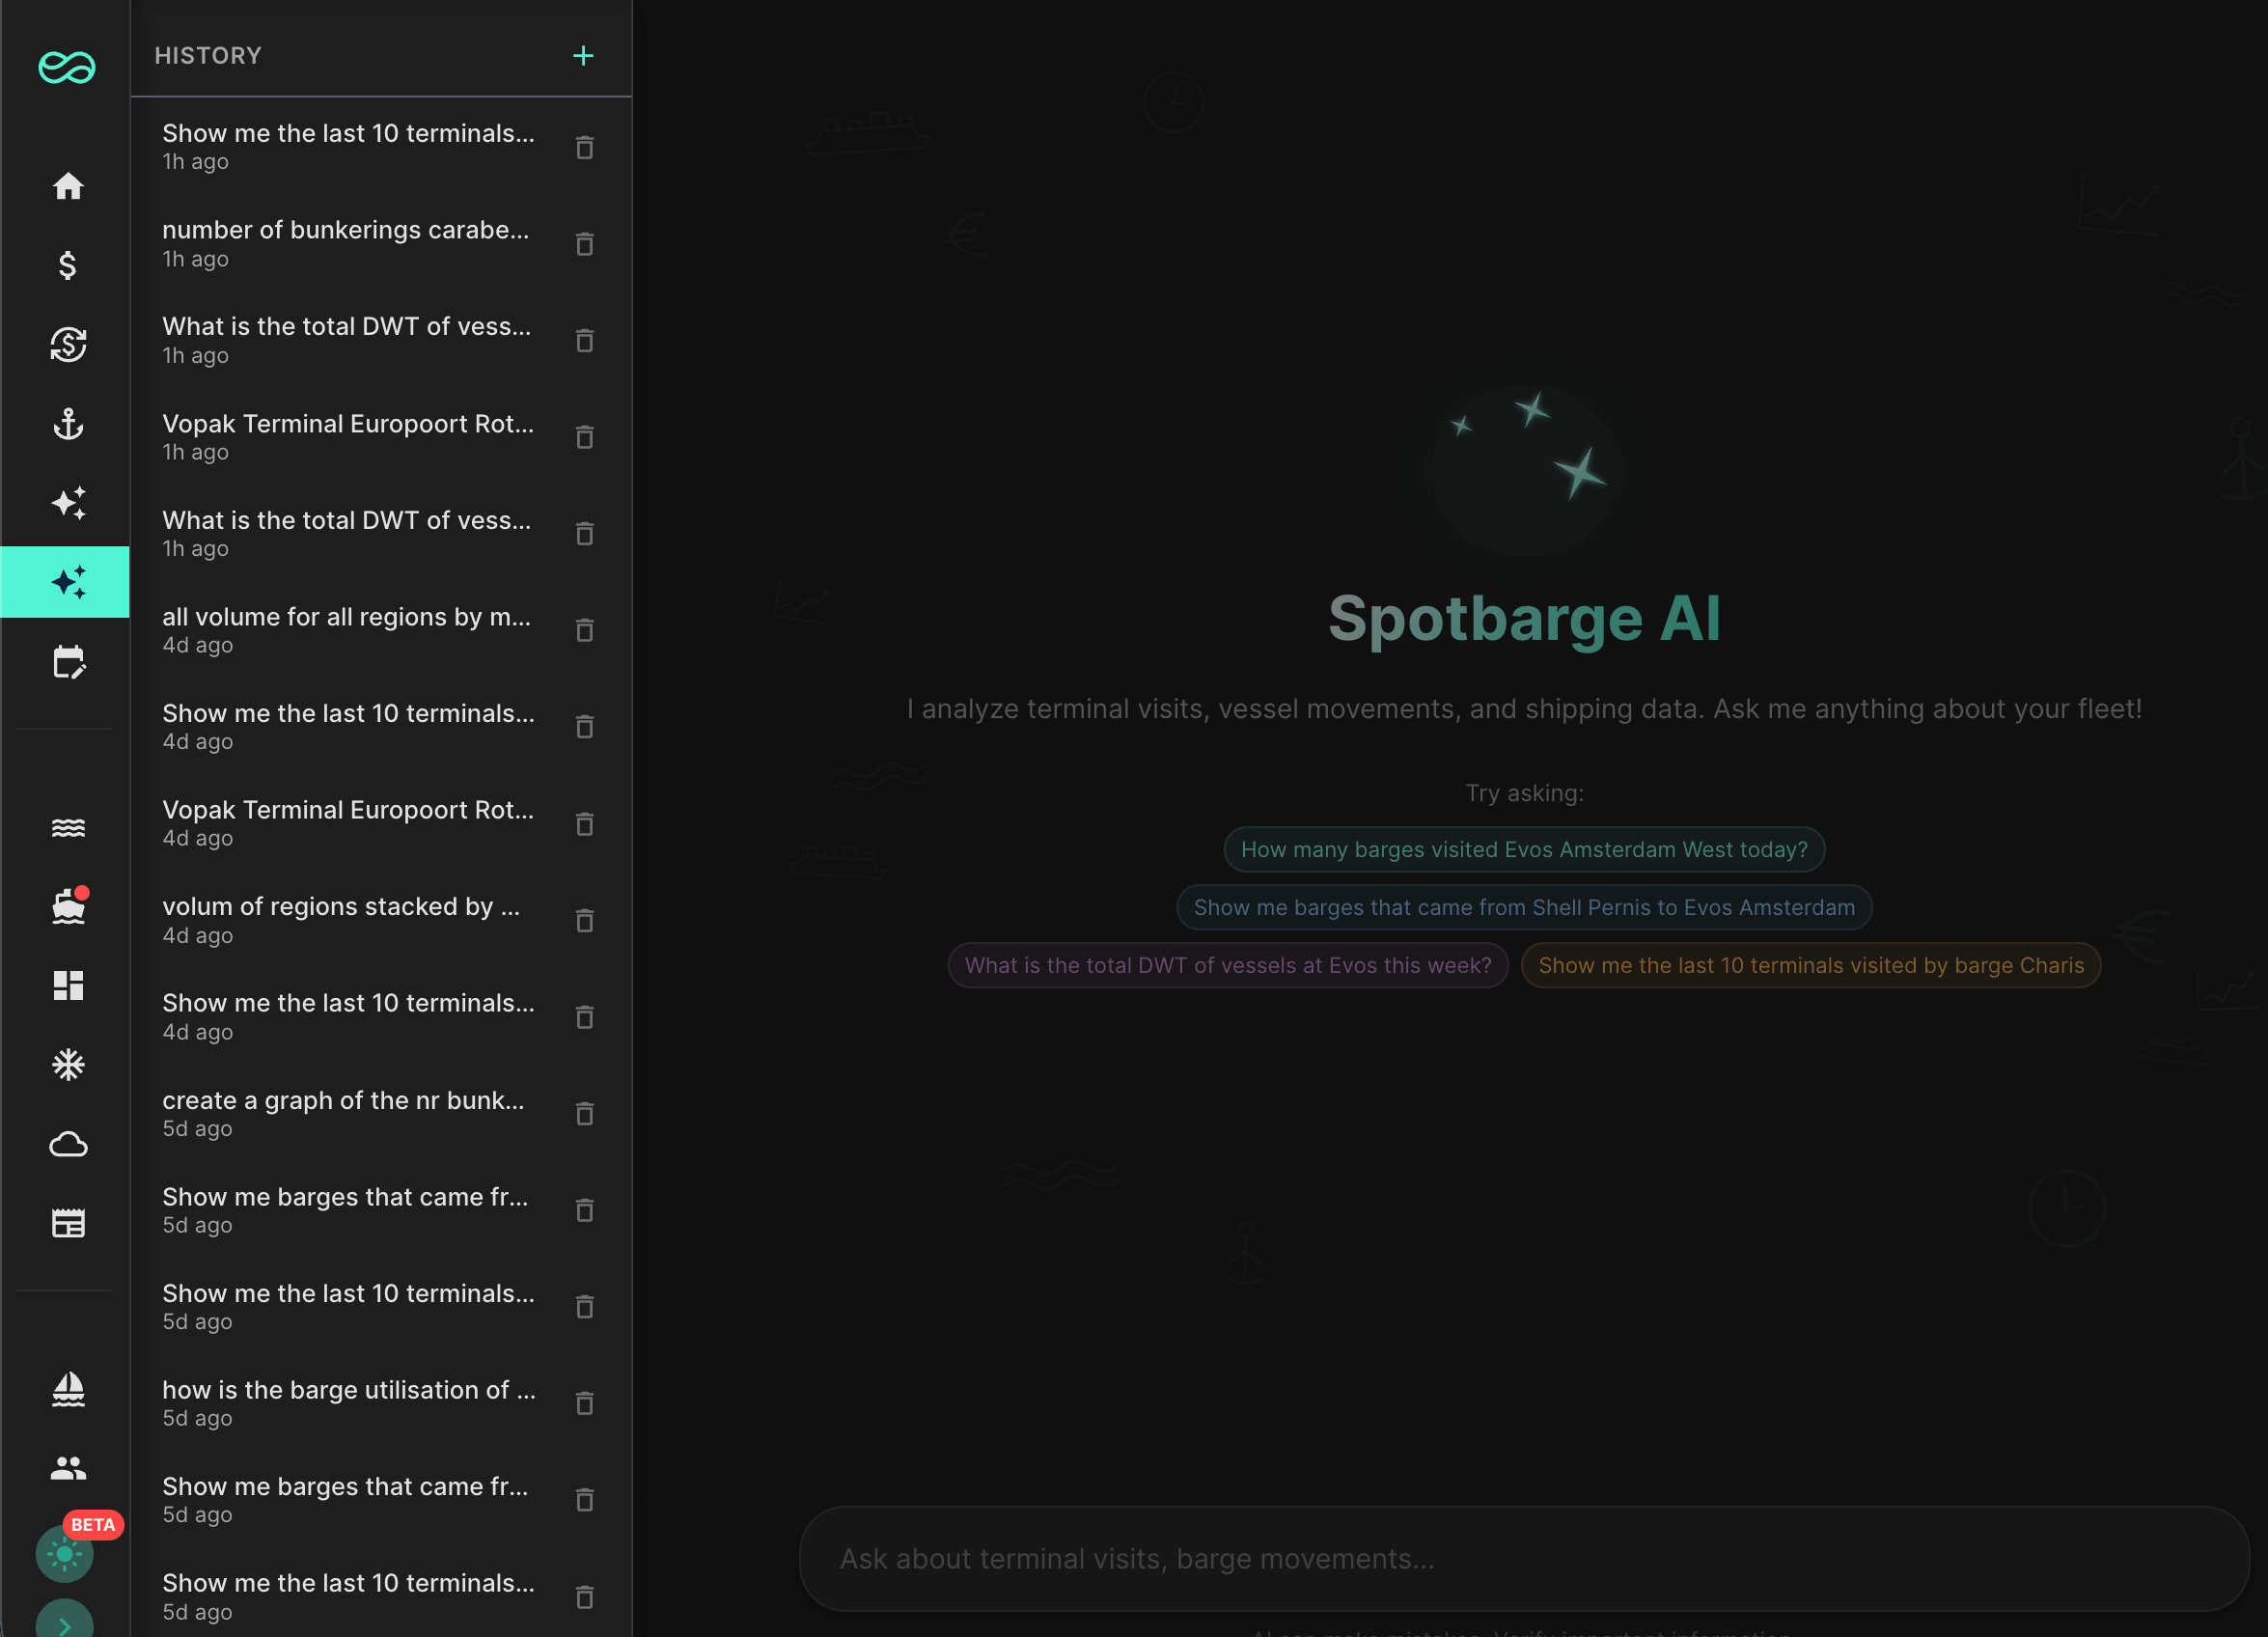
Spotbarge provides real-time bunker data and analytics for the global bunker market.
We analyze vessel movements, terminal visits & market data to power smarter decisions.

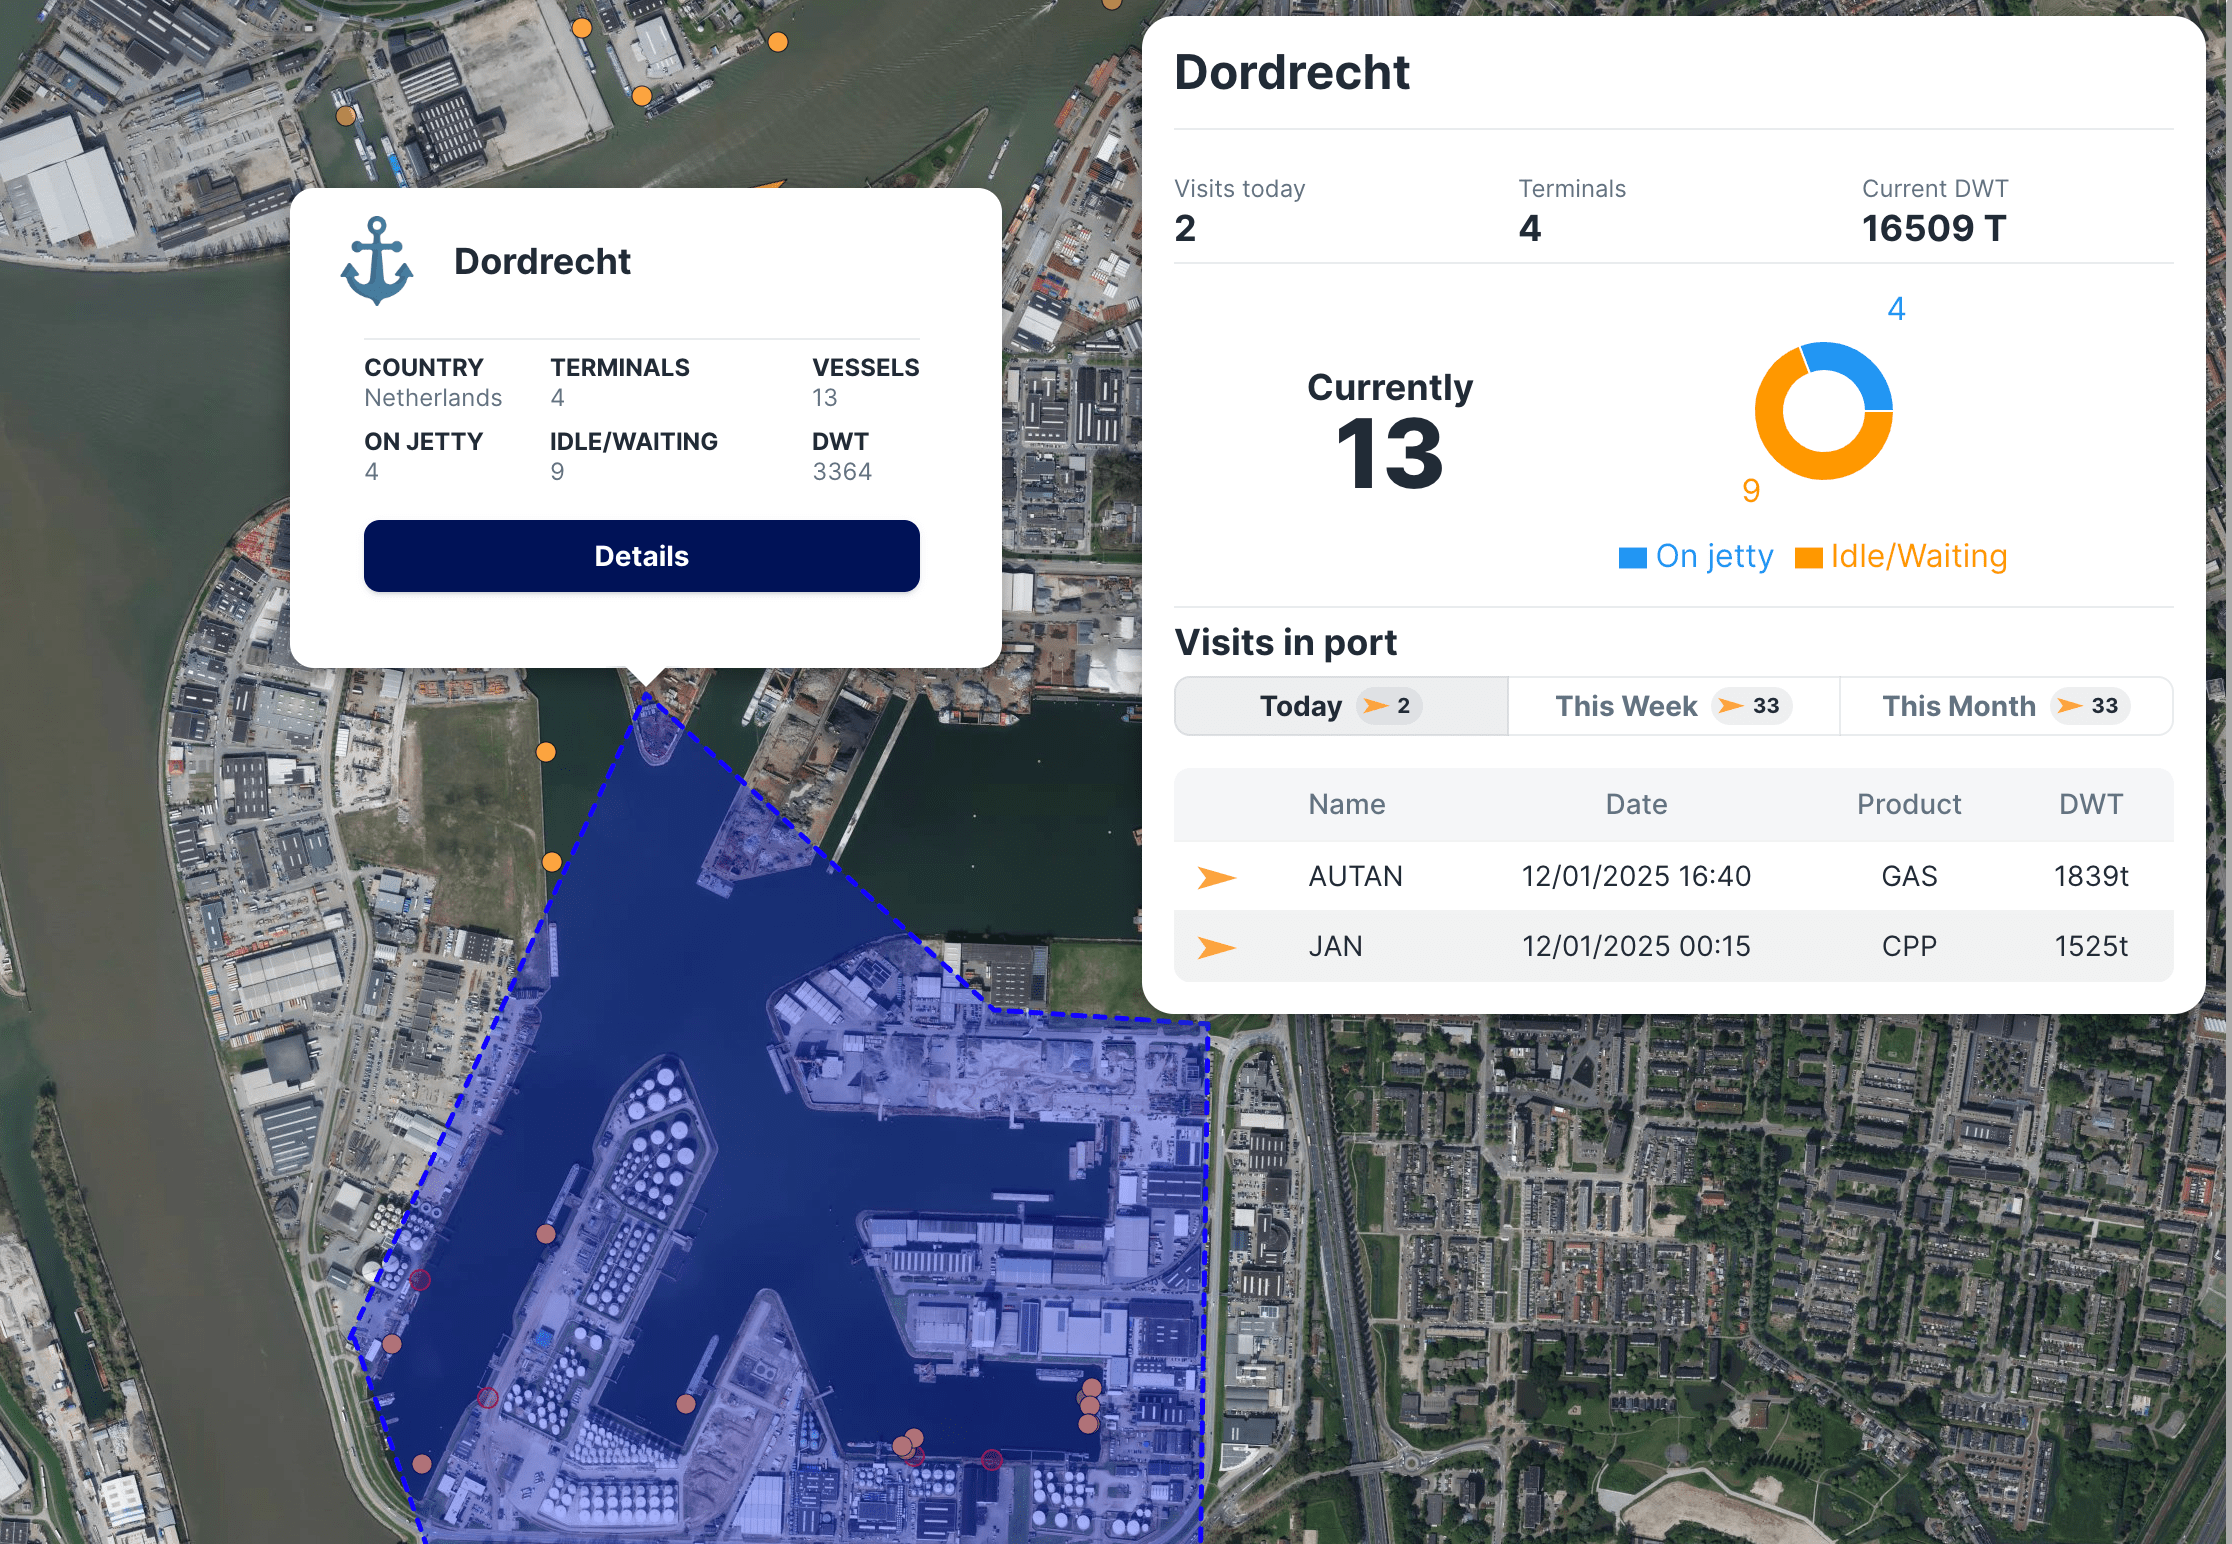
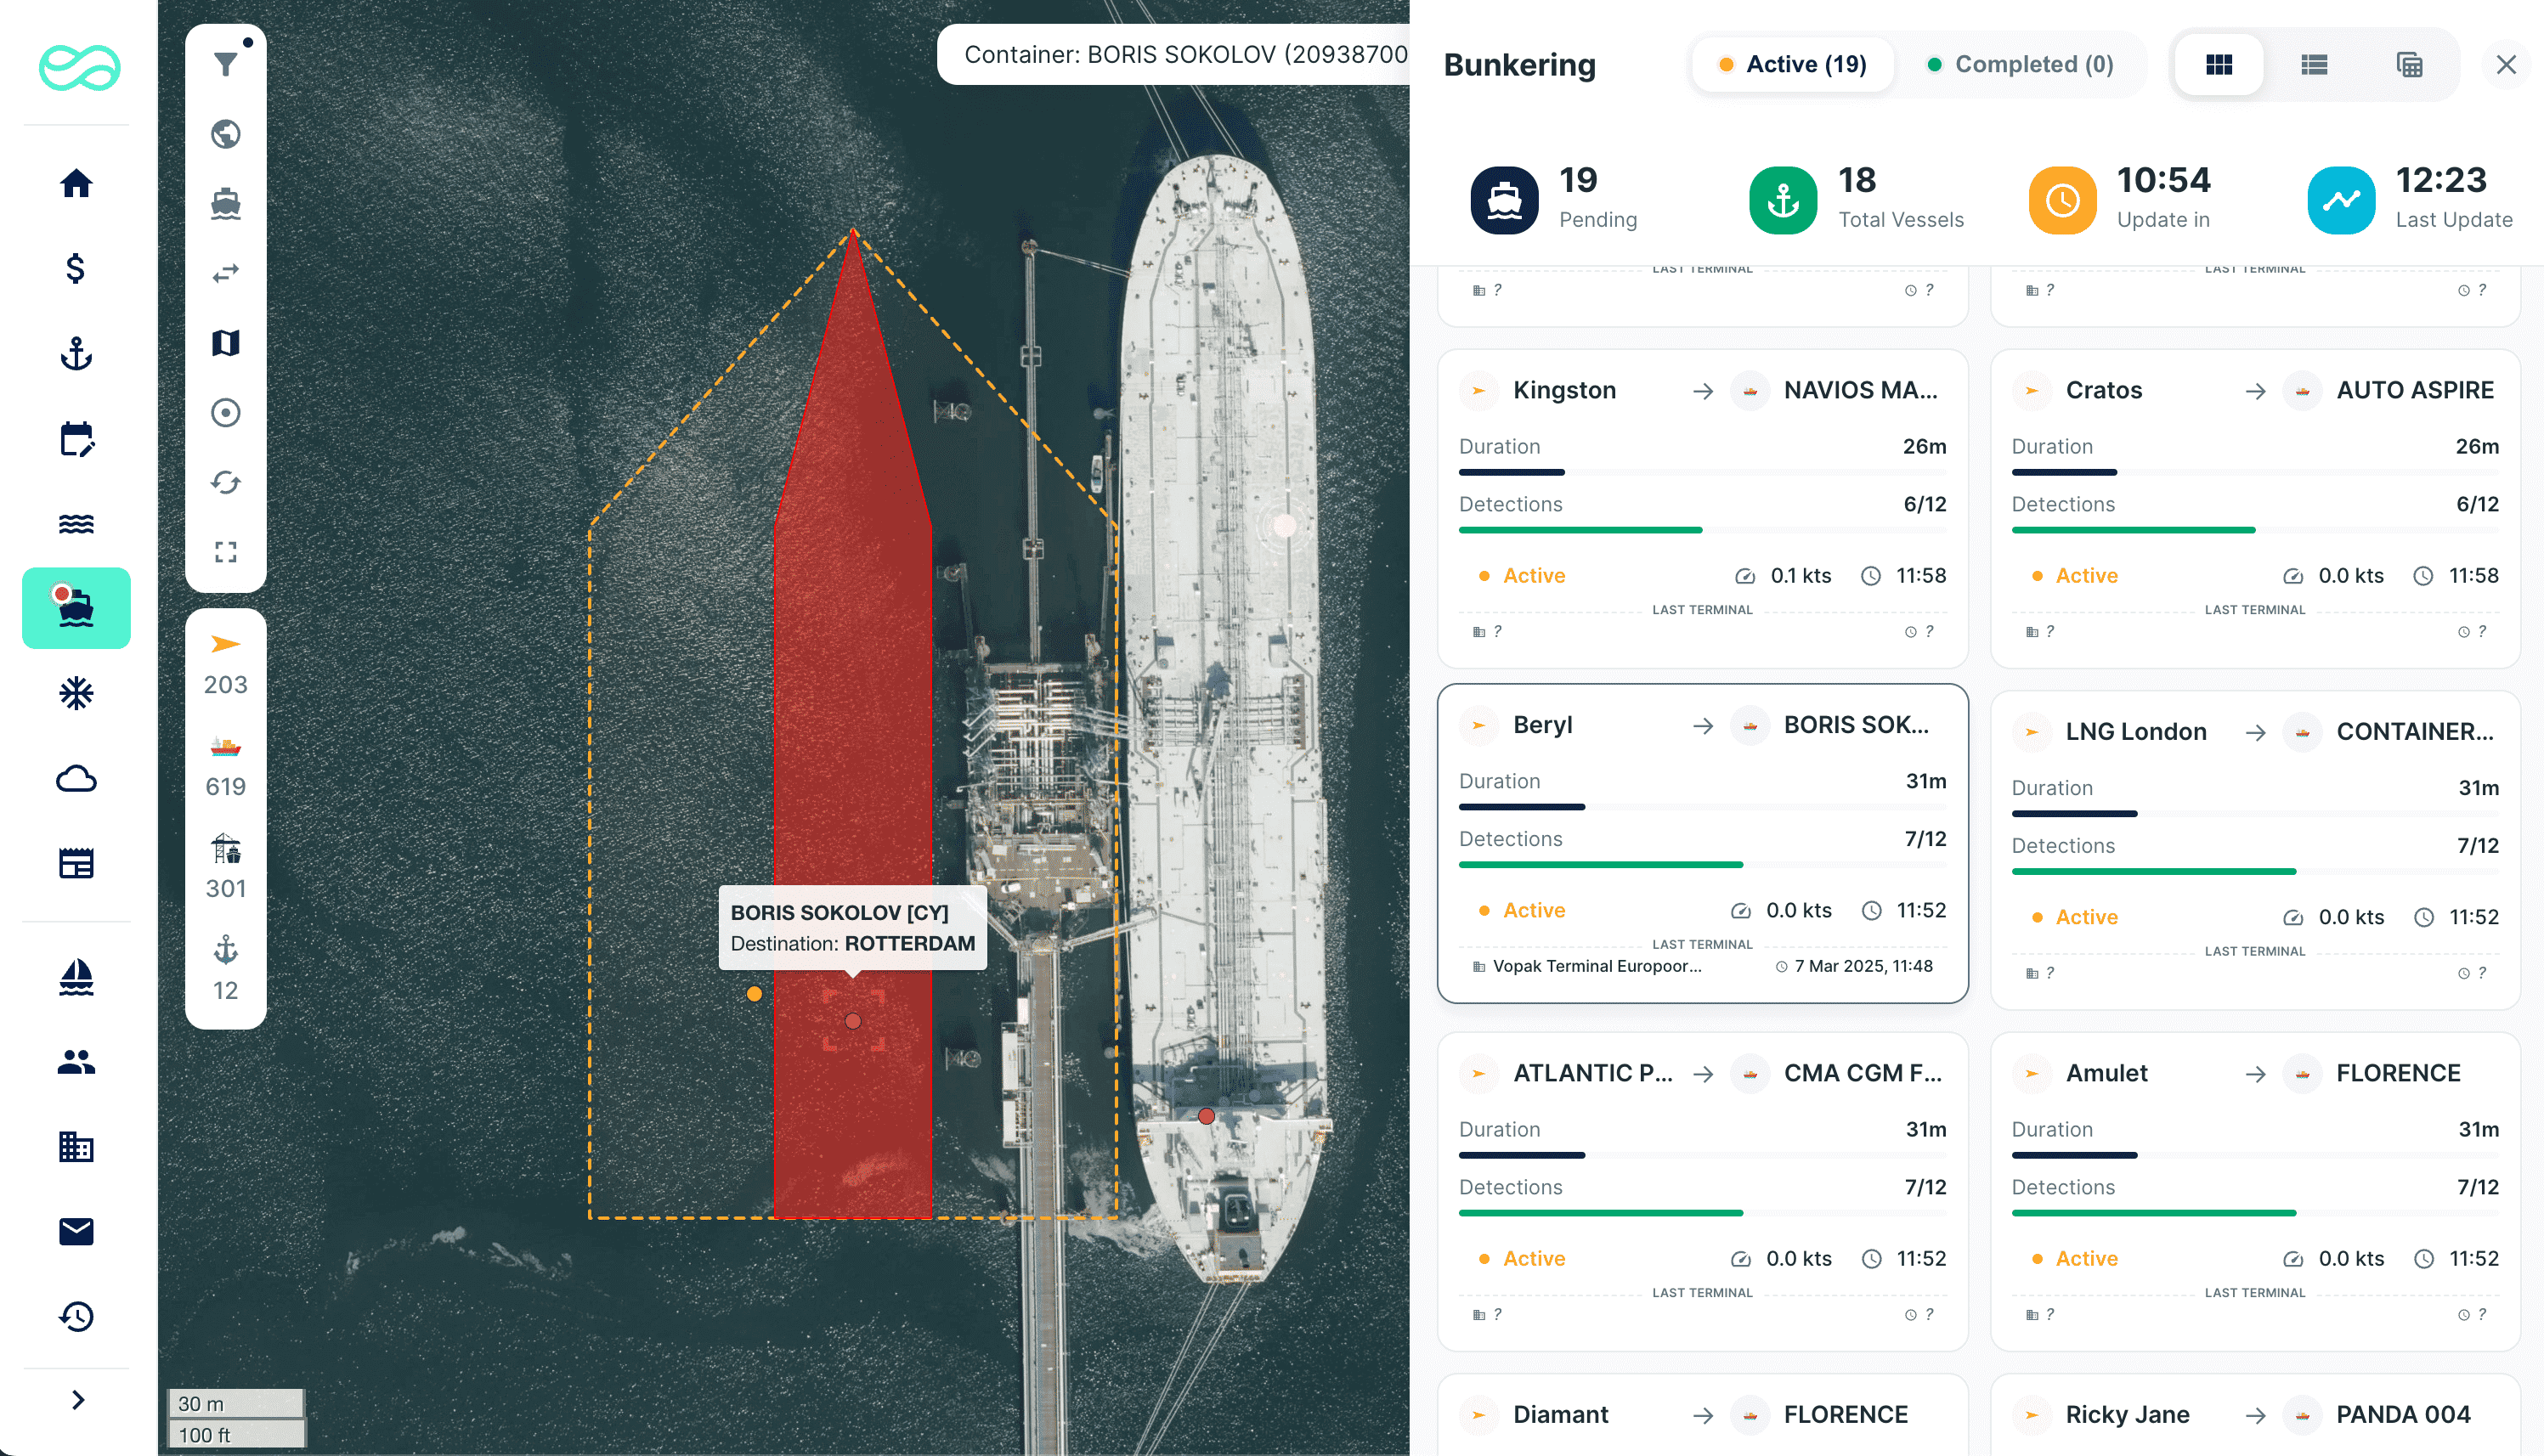
Platform Overview
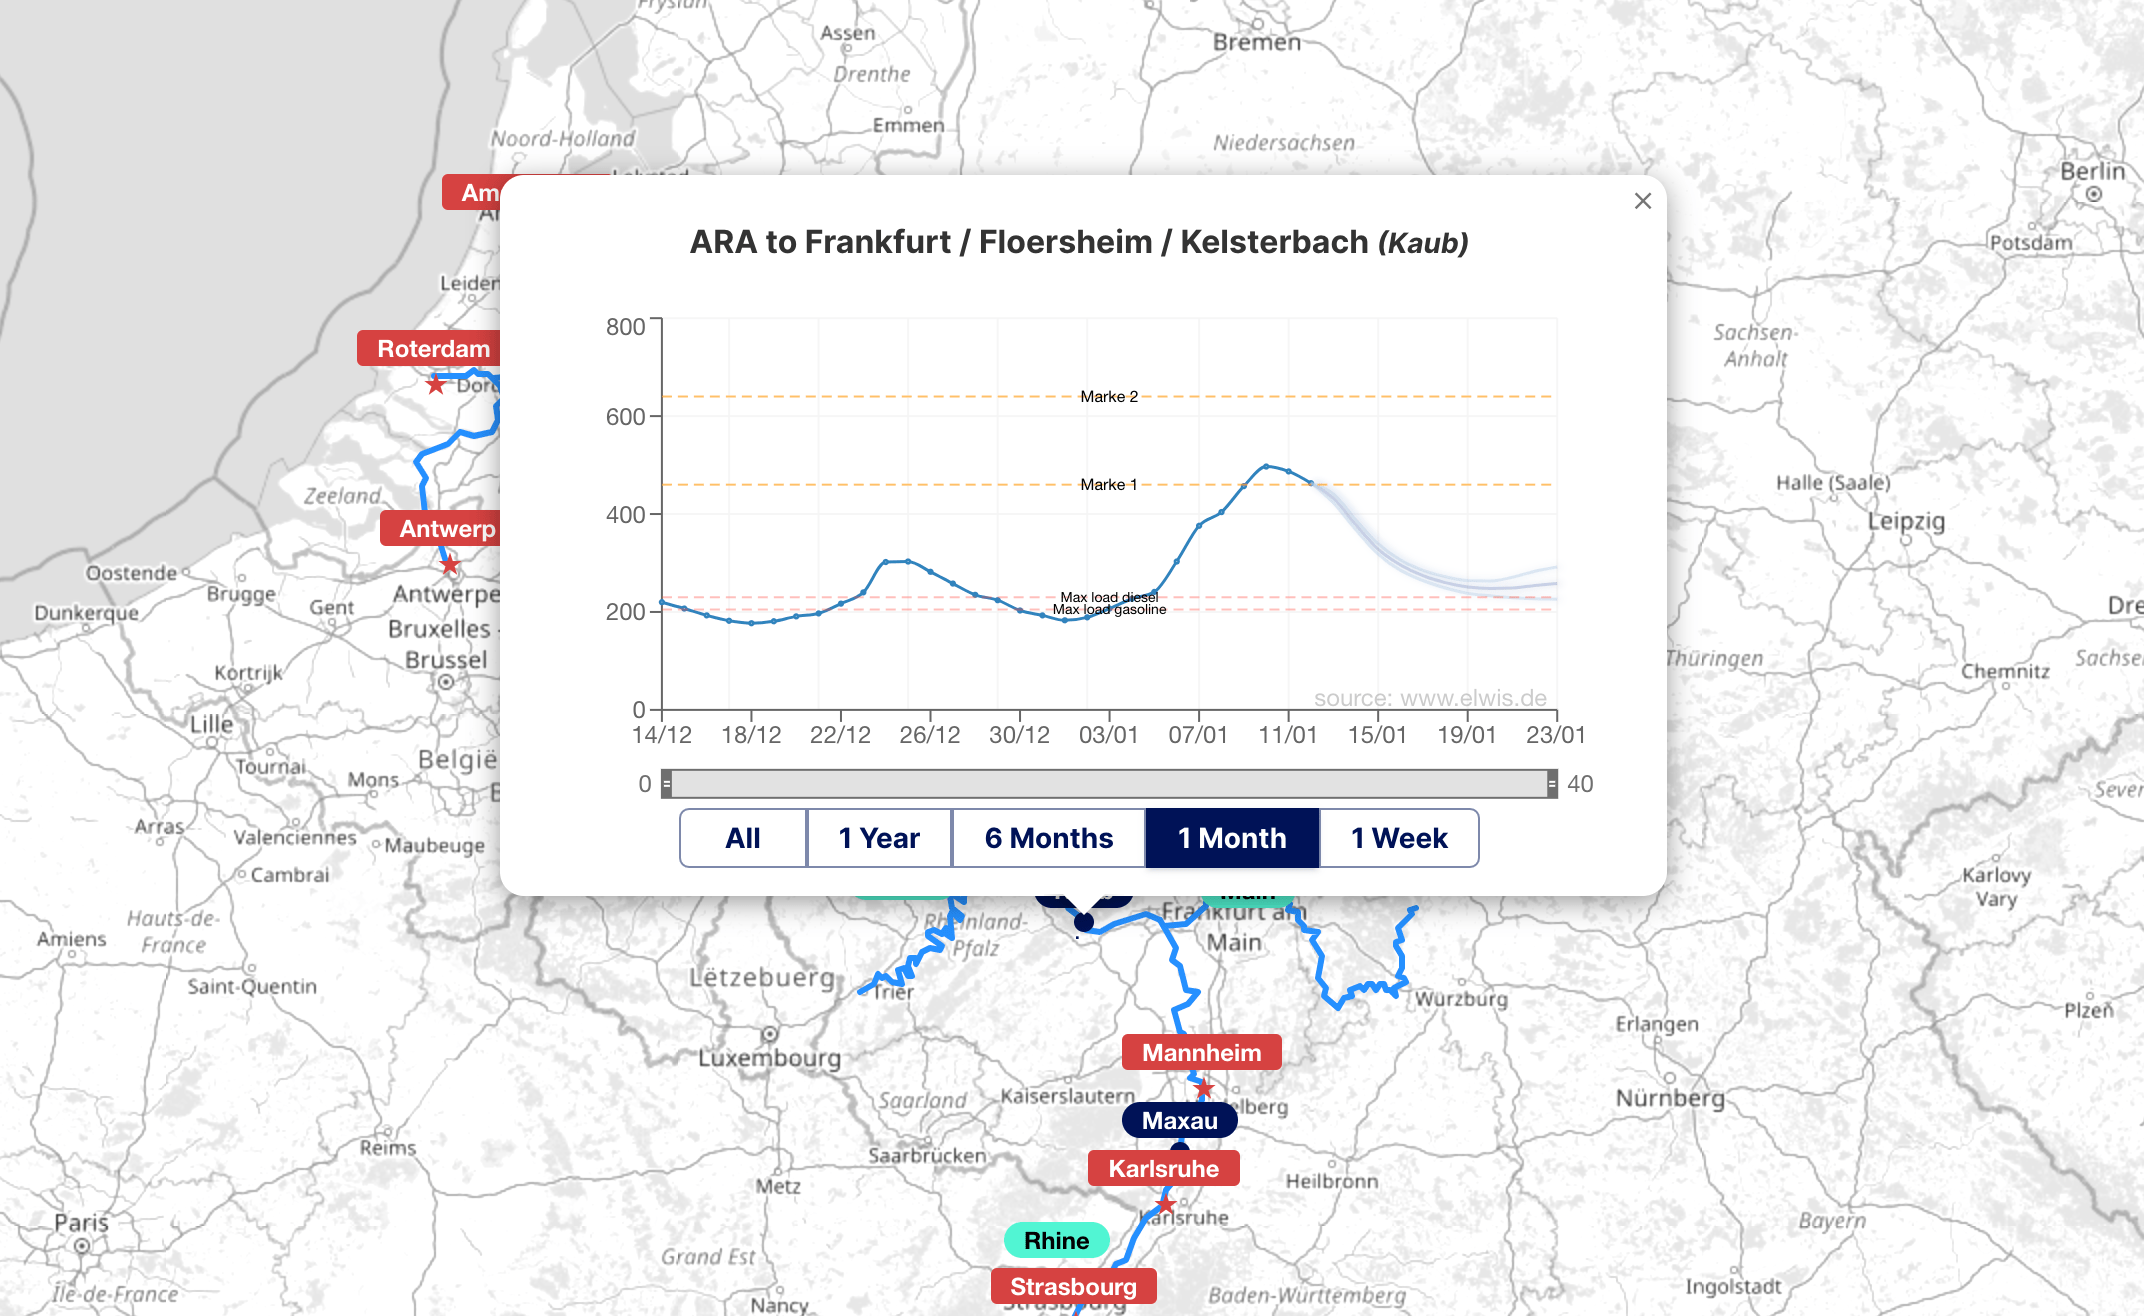
The FARAG region, home to major ports like Rotterdam, Antwerp, Amsterdam, Flushing, and Ghent, is renowned as one of the world's premier hubs for gasoline exports, fuel oil bunkering, and bio-diesel imports.
4,500+
Active barges tracked
815
Terminals & refineries tracked
129
Major ports covered
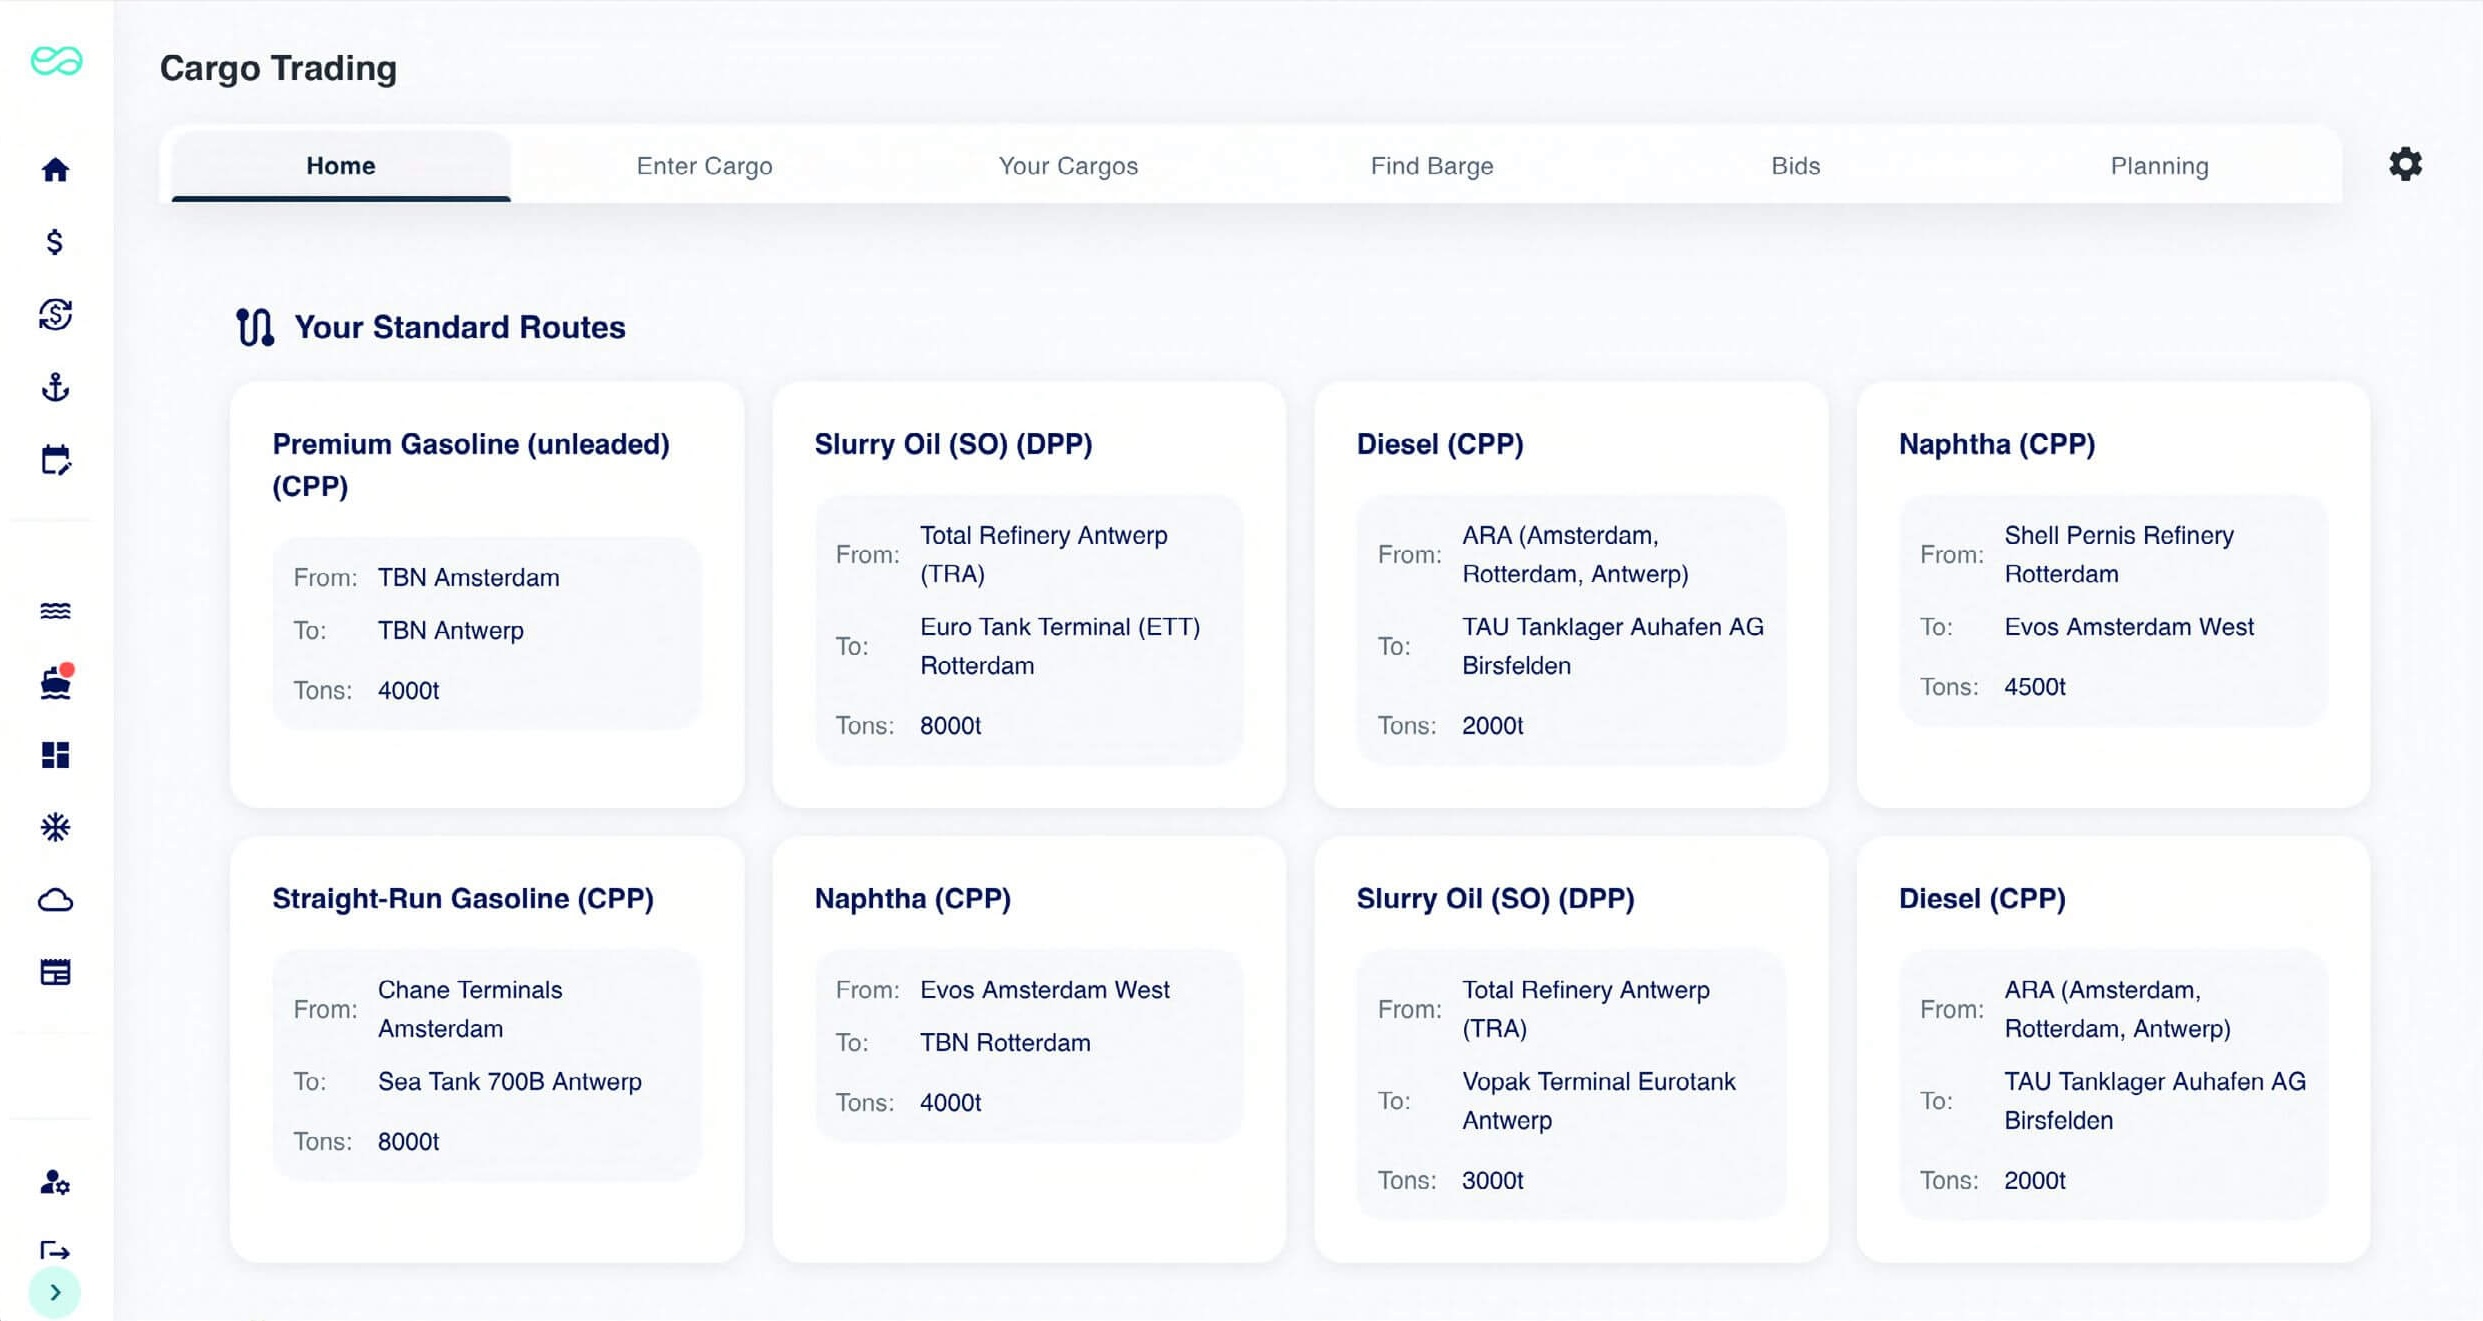
This strategic location facilitates the efficient distribution of products to key markets such as Germany, France, and Switzerland via the Rhine river, utilizing the extensive network of barge transport.
Over 1,500 barges, ranging in size from 1,000 to 12,000 DWT, reliably deliver a diverse range of products to more than 300 refineries and terminals annually. This includes light products, distillates, renewables, bunker fuel, and chemicals.
Why SpotBarge
01
Accurate data
We provide accurate and reliable data for the European inland barging industry.
02
Real-time insights
Get instant access to real-time market data and analytics to make informed decisions.
03
Industry expertise
Our team brings years of experience in the inland shipping and logistics sector.
Our Products
Discover our comprehensive suite of features.
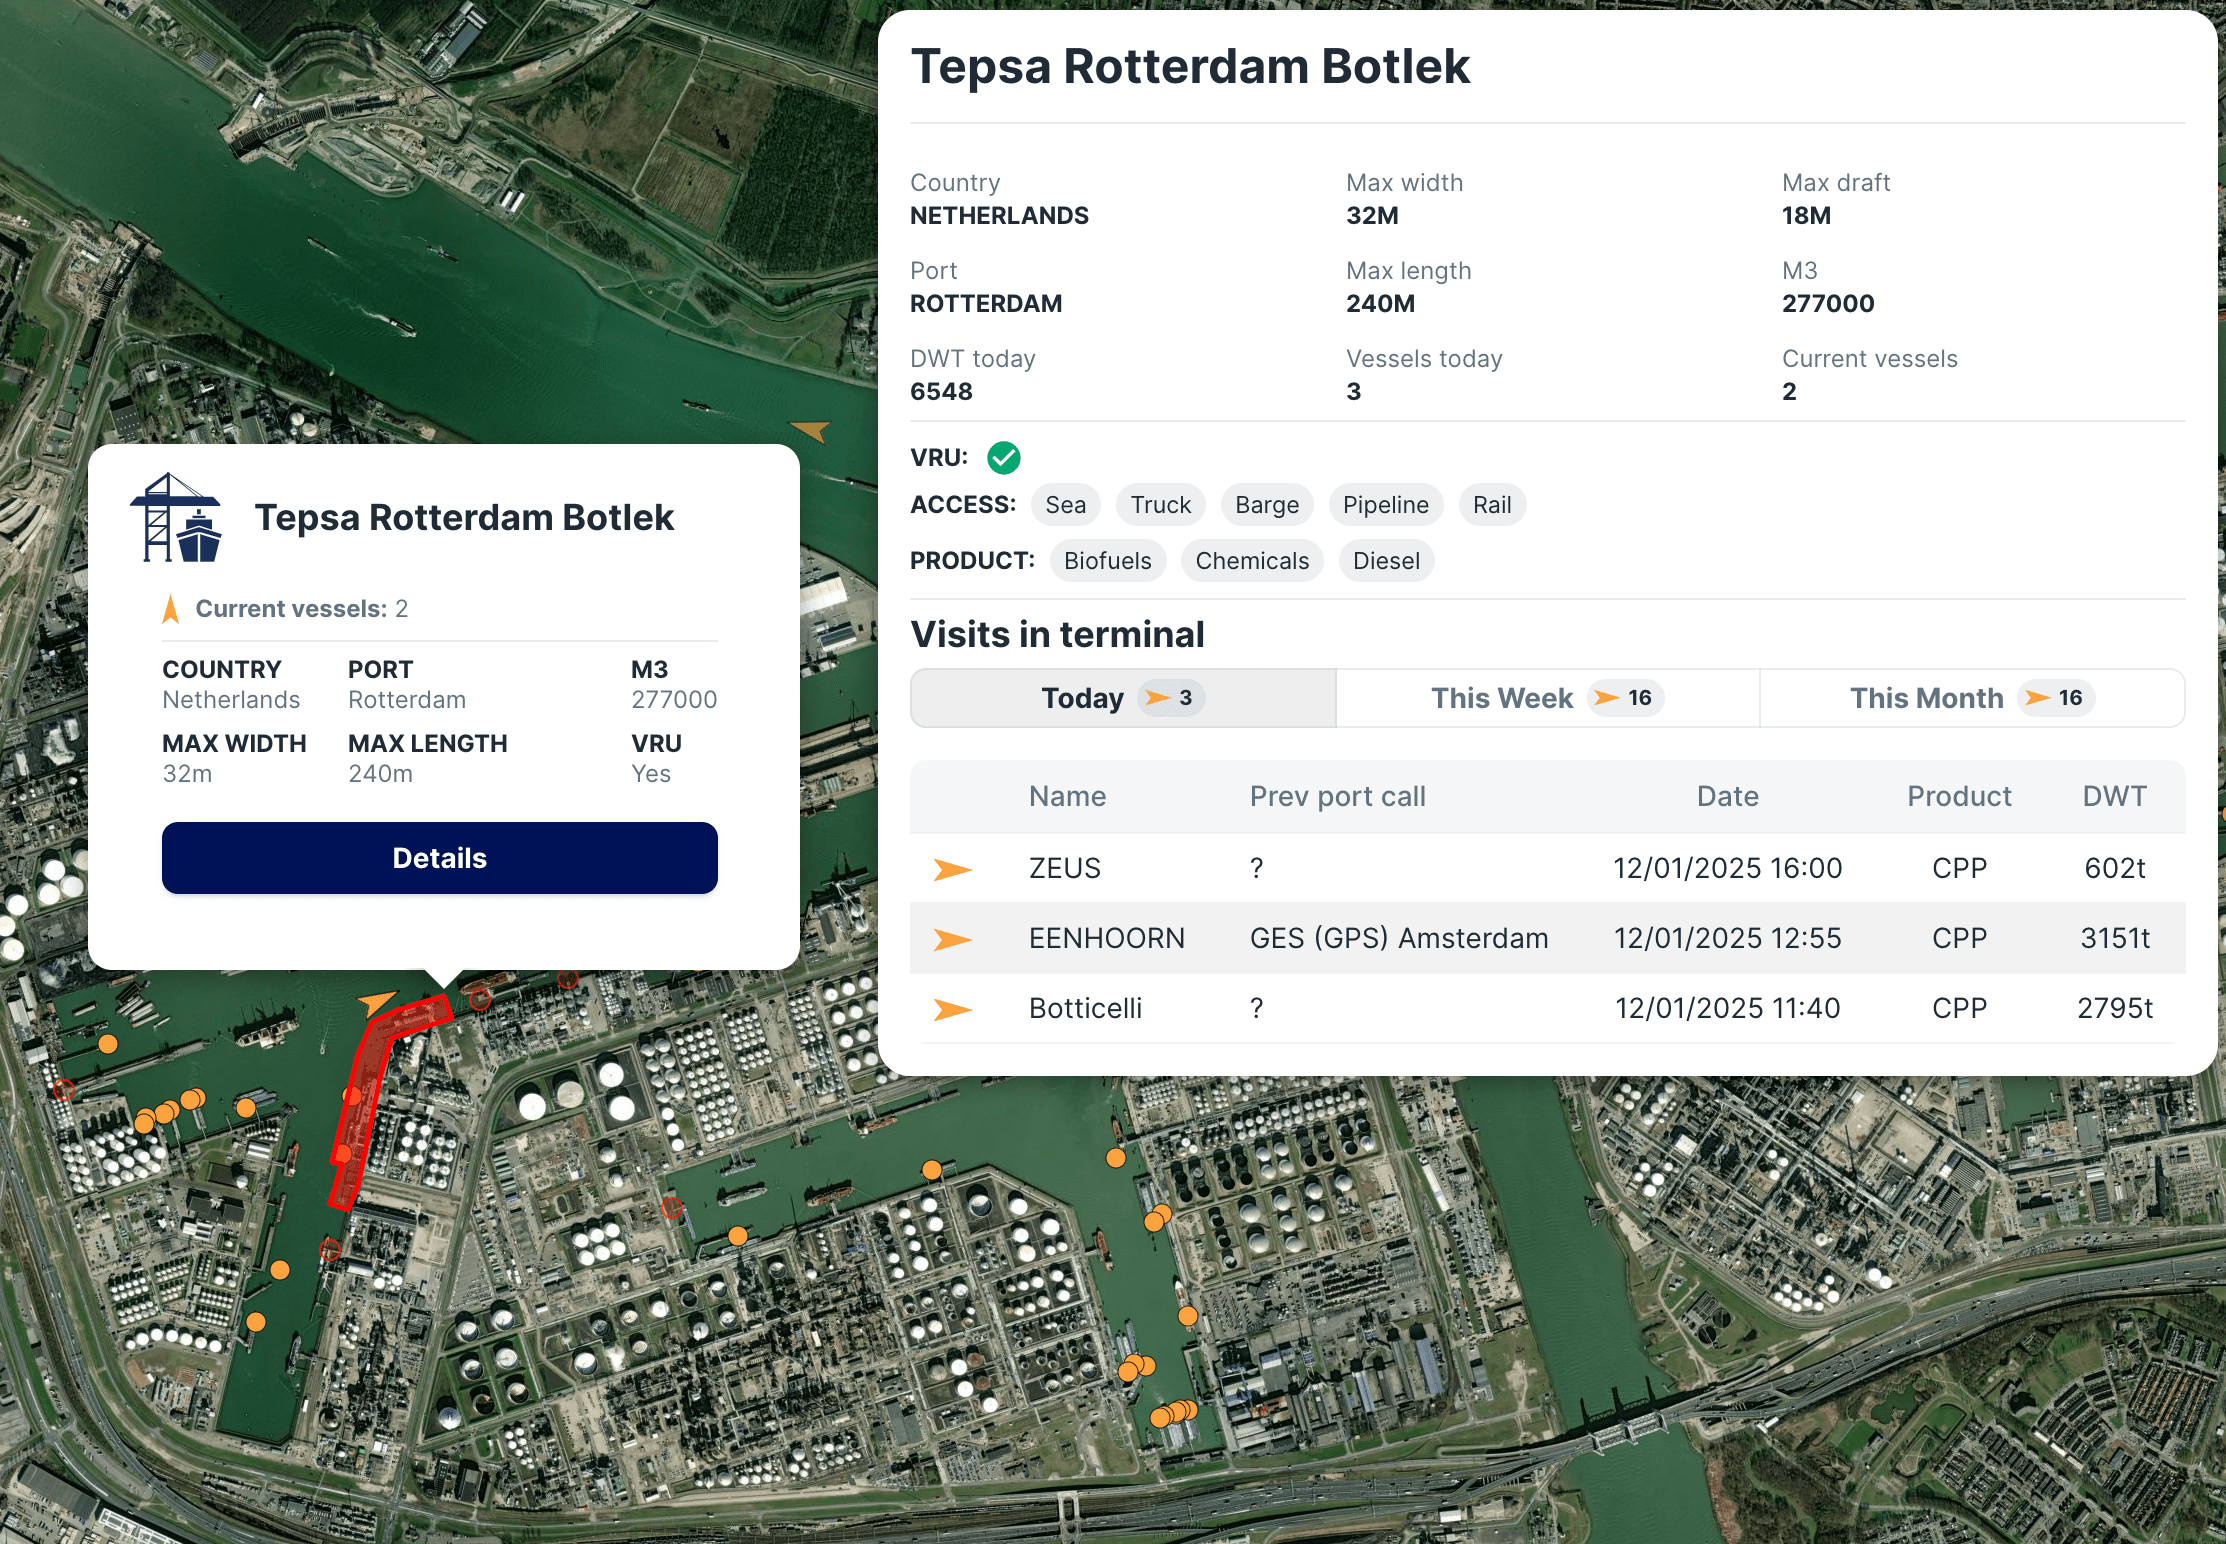
4,500+
Active barges tracked
815
Terminals & refineries tracked
129
Major ports covered
4,500+
Active barges tracked
815
Terminals & refineries tracked
129
Major ports covered
4,500+
Active barges tracked
815
Terminals & refineries tracked
129
Major ports covered
4,500+
Active barges tracked
815
Terminals & refineries tracked
129
Major ports covered
22
Major regions covered
14,000+
Track of monthly bunkered vessels
5
Map themes available
22
Major regions covered
14,000+
Track of monthly bunkered vessels
5
Map themes available
22
Major regions covered
14,000+
Track of monthly bunkered vessels
5
Map themes available
22
Major regions covered
14,000+
Track of monthly bunkered vessels
5
Map themes available
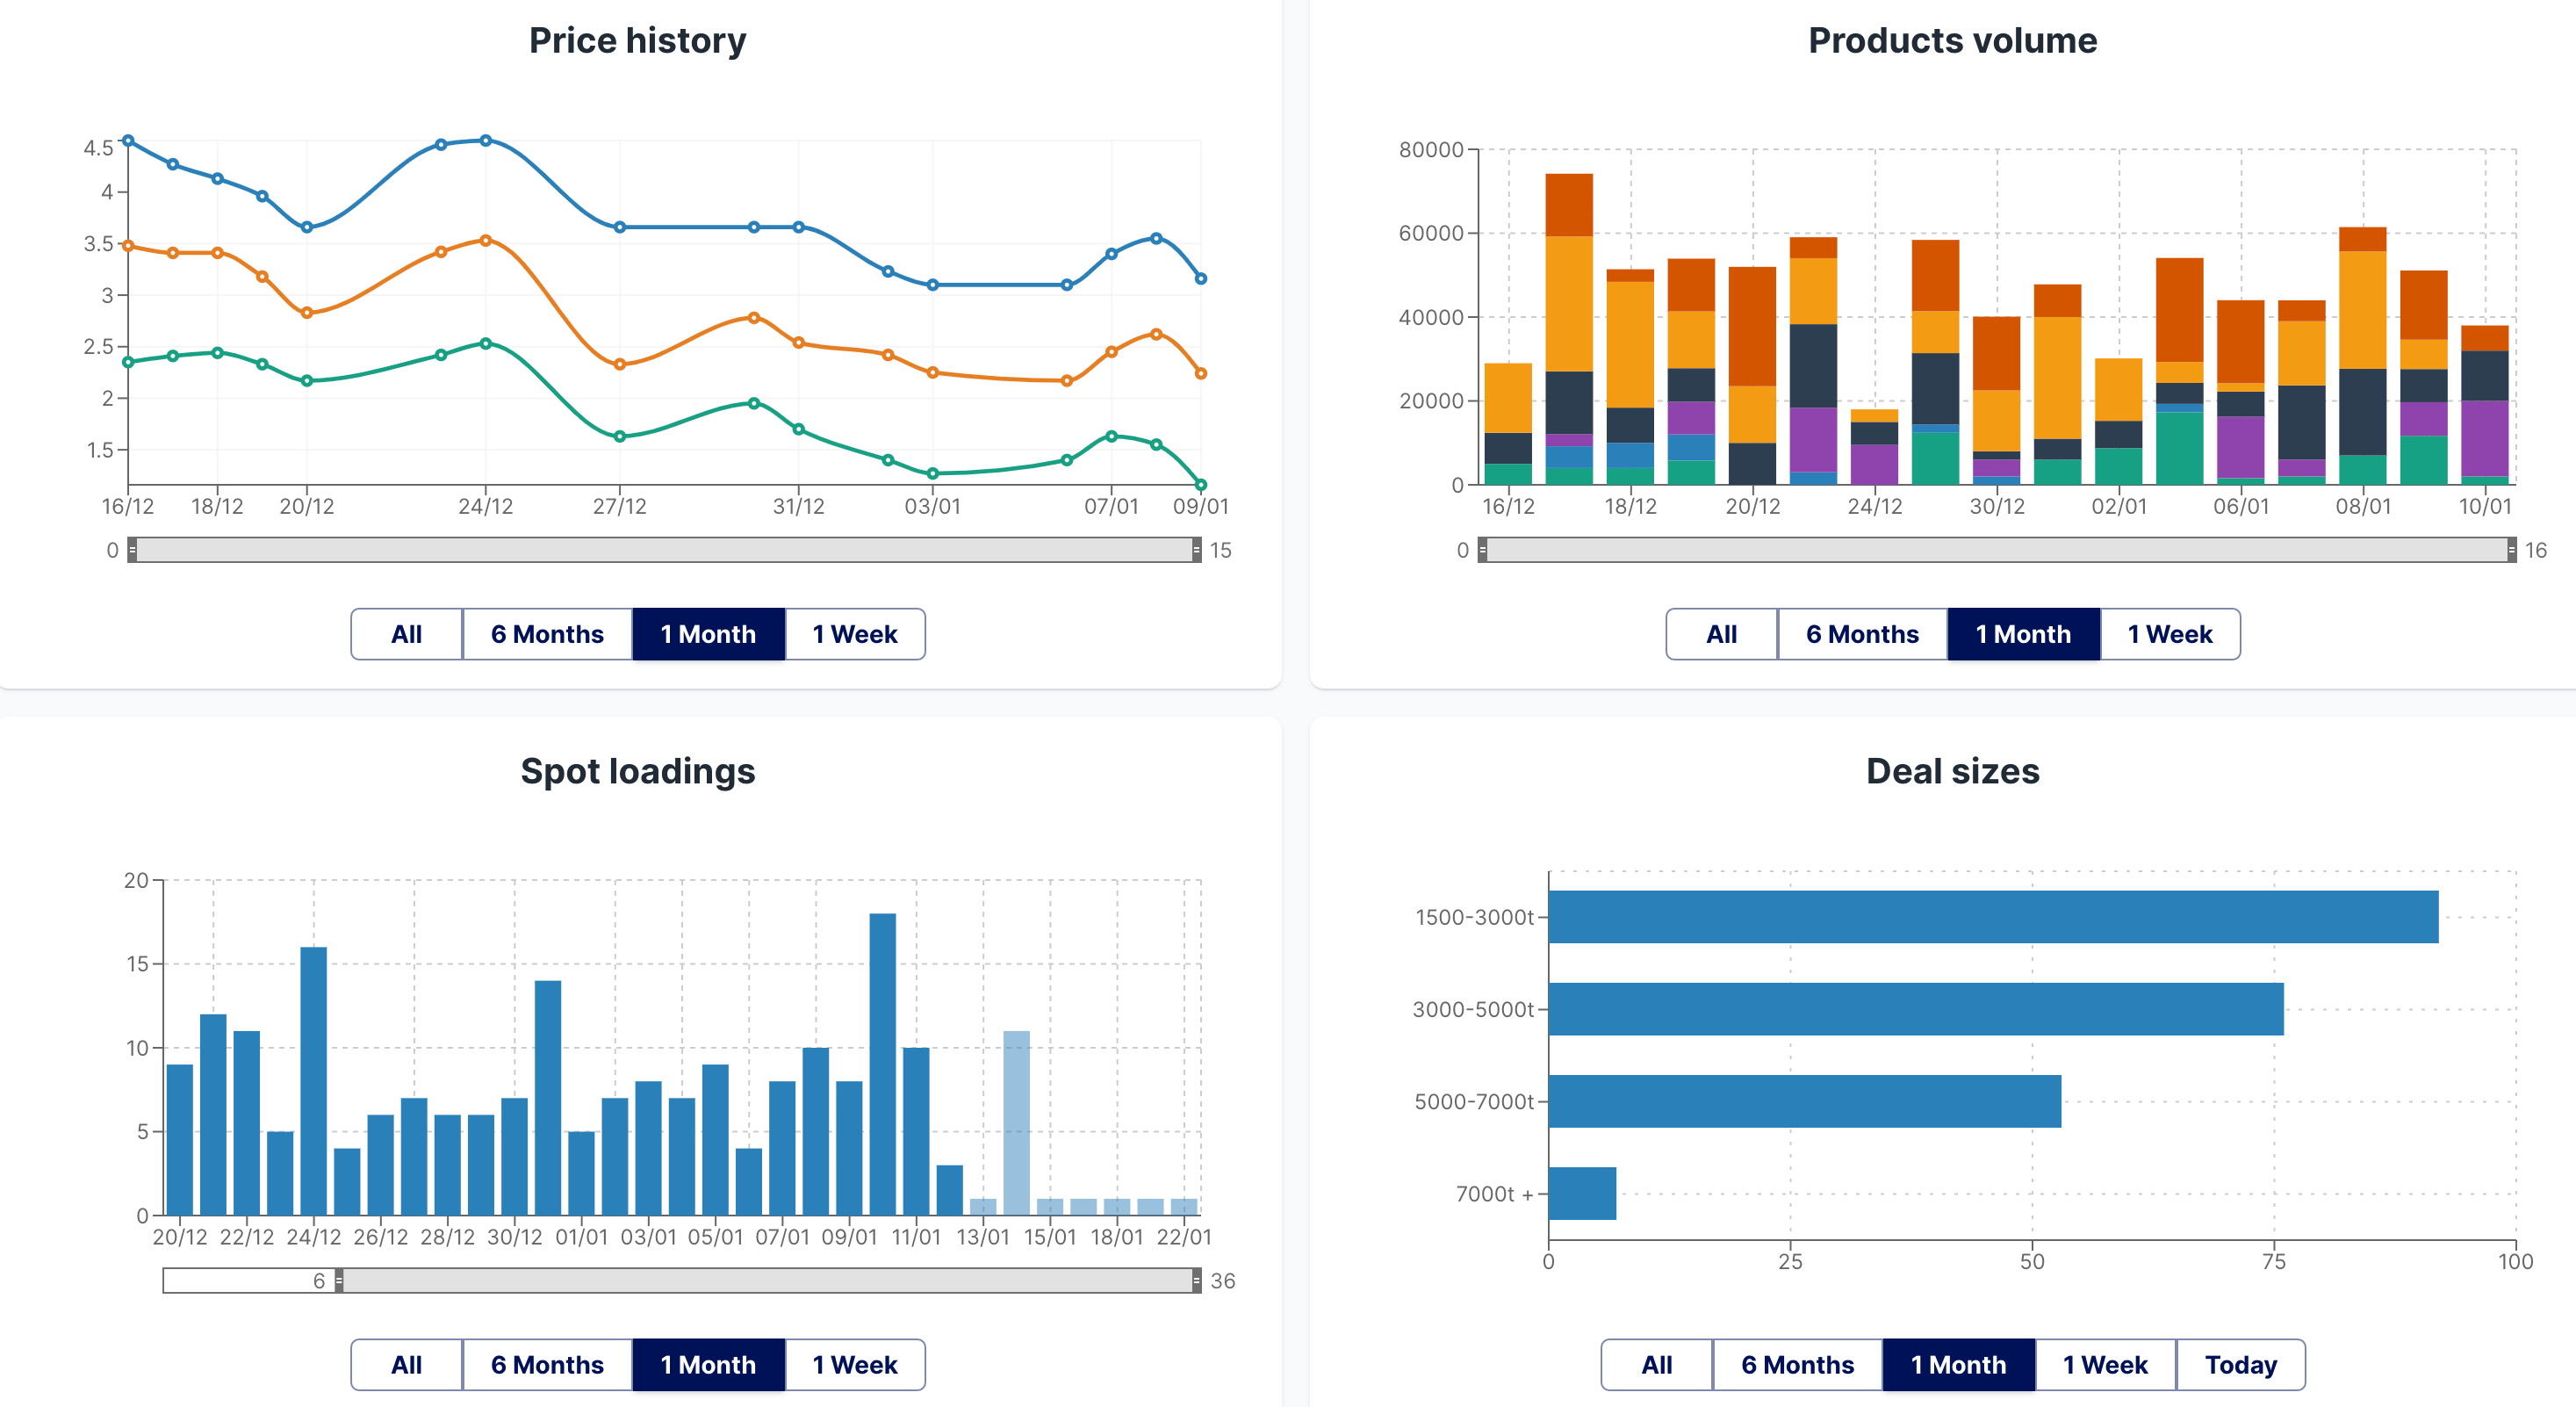
23,200+
Monthly bunkering operations tracked
9M+ t
Monthly bunker volume tracked by Spotbarge
85+
Statistic graphs available
23,200+
Monthly bunkering operations tracked
9M+ t
Monthly bunker volume tracked by Spotbarge
85+
Statistic graphs available
23,200+
Monthly bunkering operations tracked
9M+ t
Monthly bunker volume tracked by Spotbarge
85+
Statistic graphs available
23,200+
Monthly bunkering operations tracked
9M+ t
Monthly bunker volume tracked by Spotbarge
85+
Statistic graphs available
Ready to transform your operations?
Get real-time insights into the inland shipping and bunker market with Spotbarge.
Features
Users
Company
Resources
SpotBarge
© 2026 by Spotbarge B.V. All rights reserved.