logo

Data analytics

Our multi-region shipping dashboard provides a centralized, customizable hub for gaining insights into key shipping markets across different areas, such as the Rhine, and Amsterdam-Rotterdam-Antwerp (ARA) regions. This feature enables you to:

Visualise key performance indicators (KPIs) with interactive graphs and charts, including:
  • Loaded tons: Monitor total cargo volumes by region and time period
  • Tons per product: Analyze product-specific cargo volumes and trends
  • Deal sizes: Identify popular clip sizes and trends across different regions
  • Key pricing routes: Track pricing fluctuations and market trends along crucial shipping corridors
Request demo
Products volume

Products volume

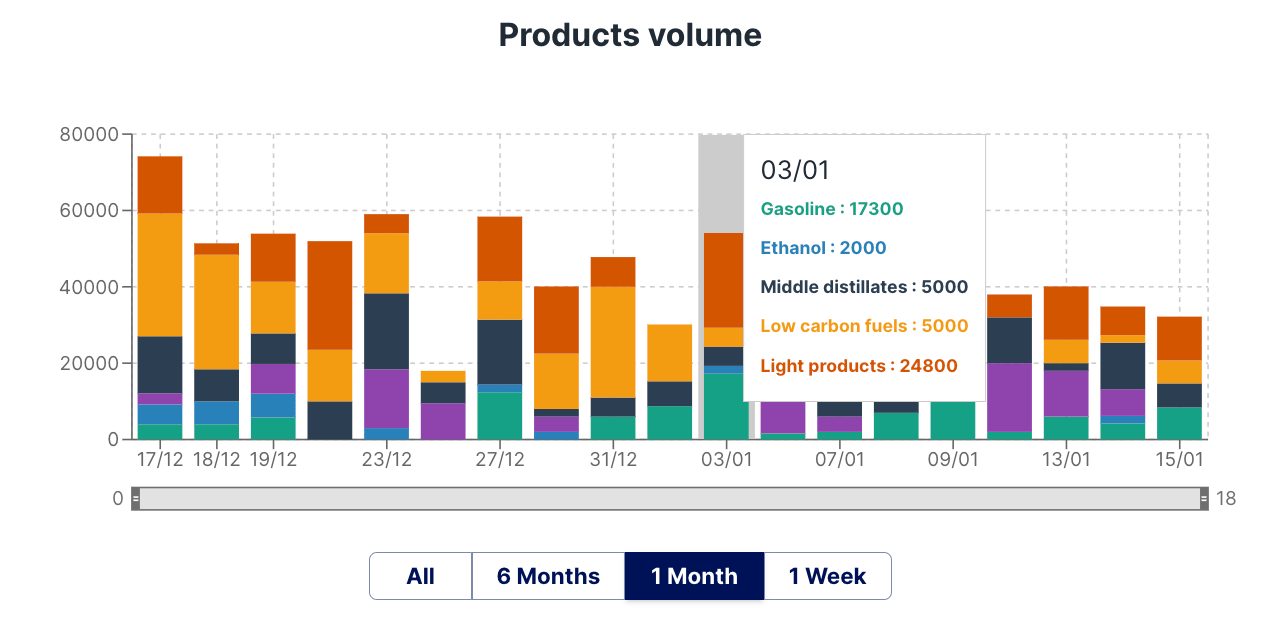
In addition to booked spot volumes, Spotbarge's advanced analytics dashboard offers valuable insights into the market's dynamics by displaying the various product types booked on a given day. This transparency enables you to:

Analyze Freight Rate Differentials: Understand why certain pre-loaded barges may command higher freight rates than others. By identifying the products on board, you can better assess the demand and supply dynamics driving rate variations.
Identify Active Market Participants: Gain visibility into which clients or product desks are actively transacting in the market. This information can help you:
  • Monitor market trends and shifts in demand
  • Make informed decisions about your own trading activities

Volume in tons per region

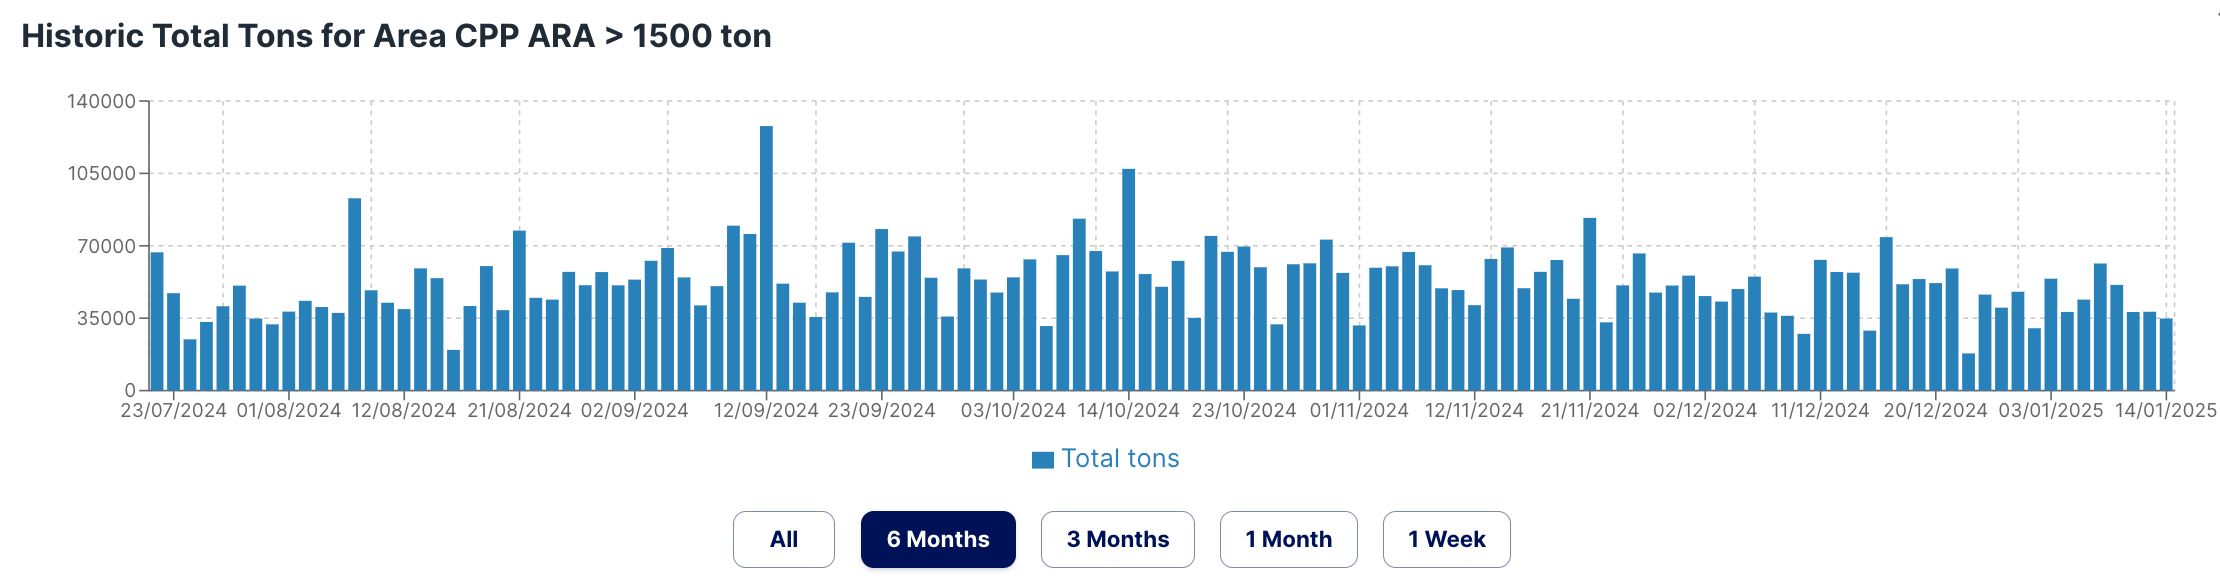
In addition to our comprehensive volumes split by products feature, we provide a dedicated Spot Tons graph that offers a clear and concise overview of booked total spot tons per region.

Volume in tons per region
Barge loadings

Barge loadings

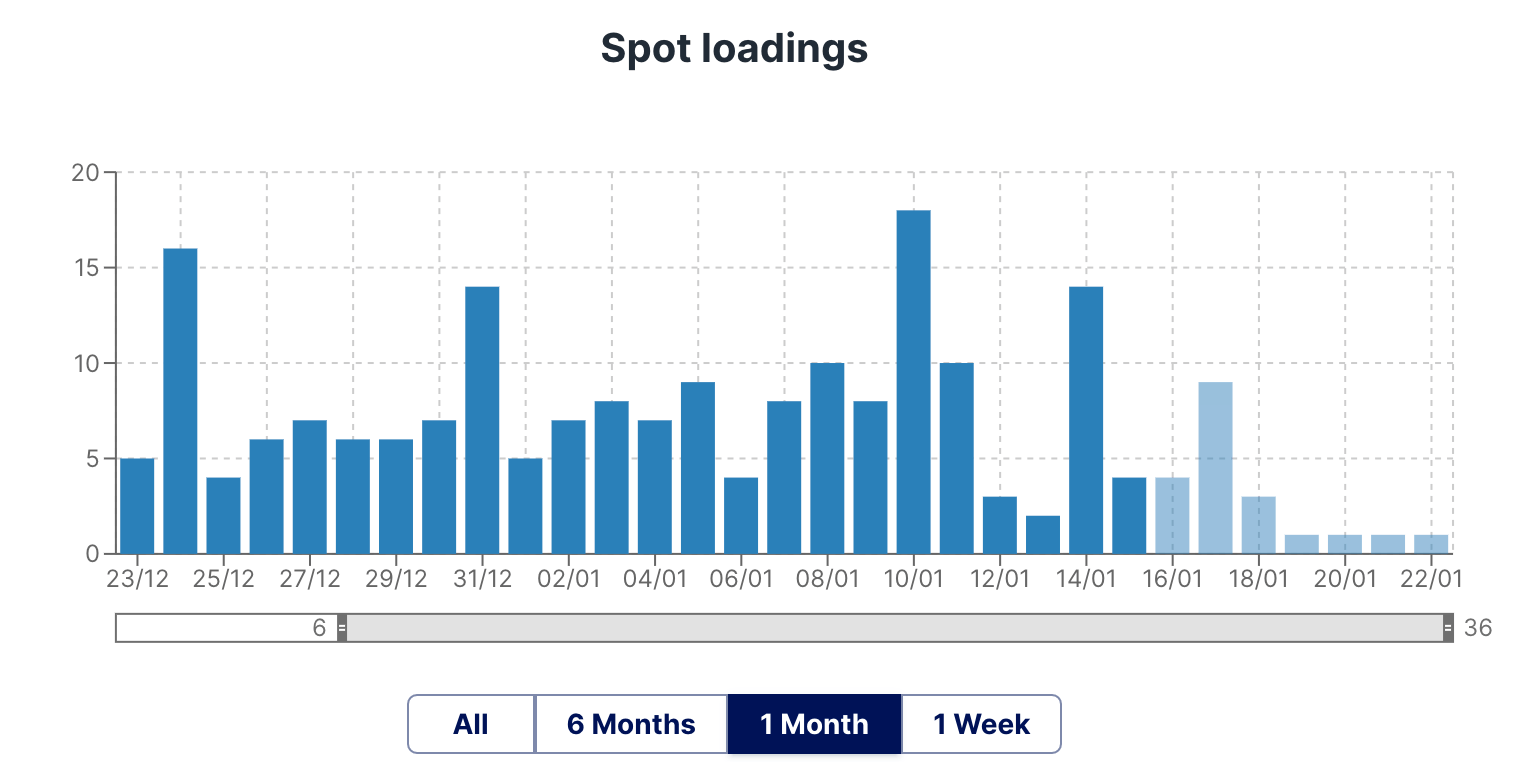
Spotbarge's barge loadings feature offers a real-time snapshot of the number of barges nominated for loading on a given day. This valuable metric helps you:

  • Assess market demand: Understand why freight rates may be higher on certain days, as increased barge nominations can indicate stronger demand and tighter supply.
  • Evaluate spot market activity: Gain insights into the overall busyness of the spot market by monitoring daily barge loading nominations. A higher number of nominations suggests a more active market.
Deal sizes

Deal sizes

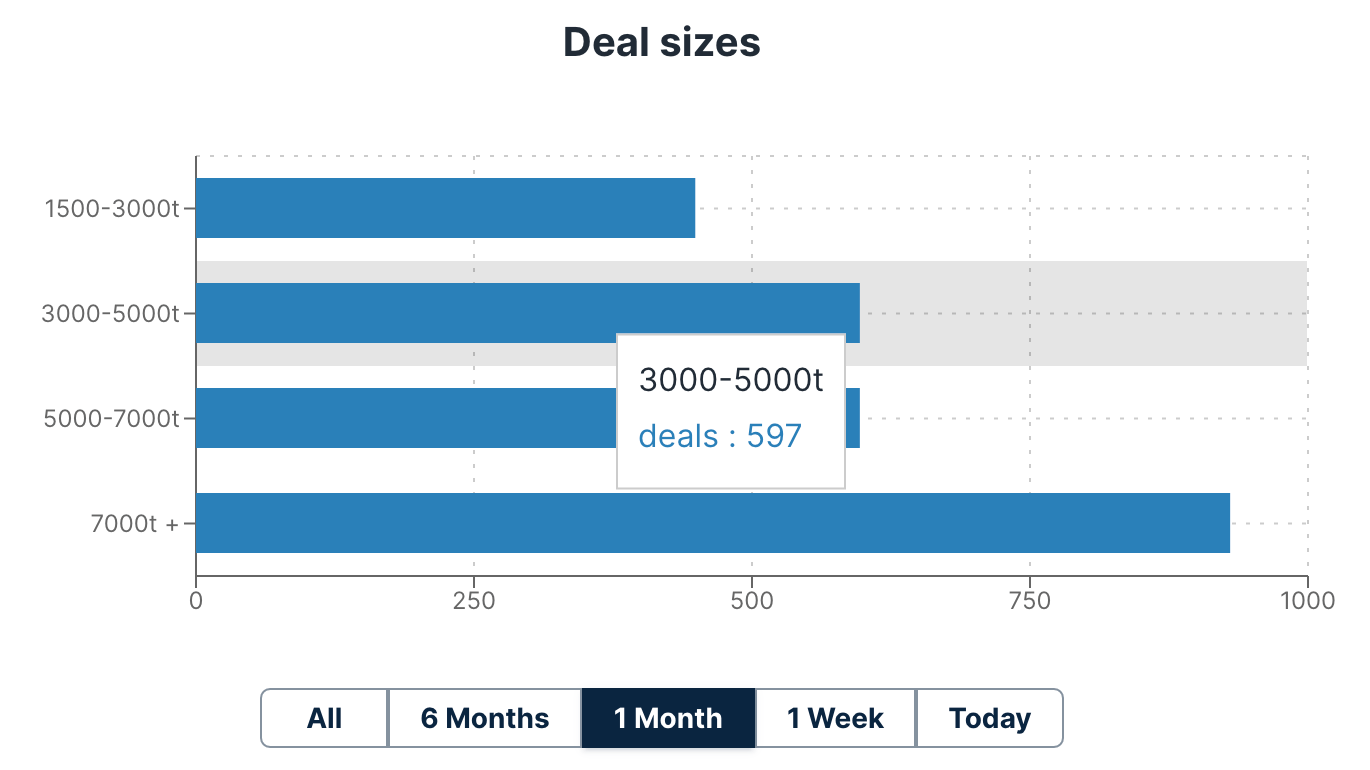
The deal size analytics presents the most frequently traded clip sizes for a specified period, be it daily, weekly, monthly, or even over a six-month span. This metric offers valuable insights into market trends by revealing whether smaller parcels or larger barges are currently in higher demand. By tracking these trends, one can better understand and anticipate price fluctuations, as increased demand for a particular deal size can drive up prices, while a surplus can lead to decreases.

Pricing key routes

Pricing key routes

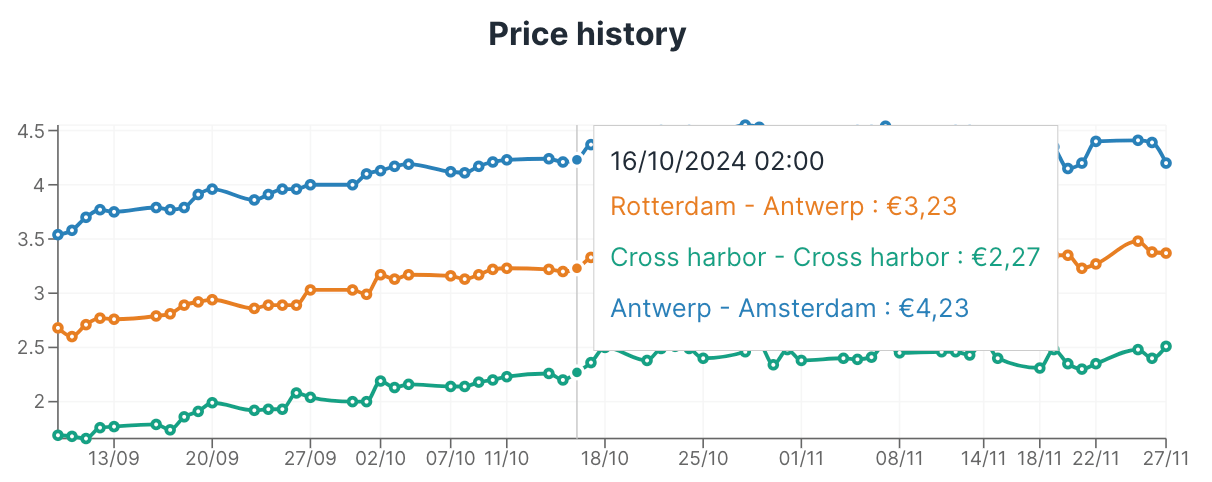
Our detailed pricing summary for key routes offers a comprehensive, yet easy-to-grasp overview of pricing trends over a selected time period. This valuable tool enables you to:

  • Quickly identify market trends and fluctuations
  • Compare pricing patterns across different routes
  • Understand the market's recent trajectory and its potential direction
  • Make data-driven decisions to optimise your shipping strategies
  • Stay informed about market conditions and adjust your pricing expectations accordingly

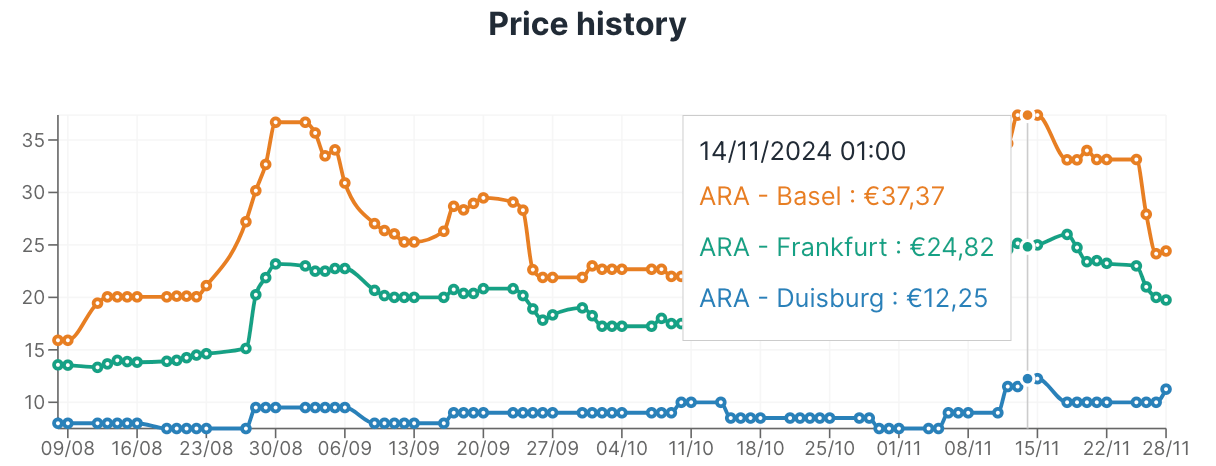
By providing a clear and concise snapshot of key route pricing, our summary helps you stay ahead of the curve and remain competitive in the ever-changing shipping landscape.

By offering a rich, interactive, and customizable pricing summary, we empower you to gain a deeper understanding of the market, make data-driven decisions, and stay ahead of the competition.